
Advanced Excel Skills to Boost Productivity and Proficiency
Let us guess - you started your Excel journey a long back, learned a few tricks and formulas along the way and finally have reached the crossroads thinking what you can do next to learn Excel to improve yourself further.
Excel on its own is such an intricate network of functions, tools and pieces of data such that it can rival even the colossus library of Alexandria.
All of these gifts bestowed from Excel can be used to develop a particular set of skills over time. Skills can make you a blessing for yourself by allowing you to leave early to watch your favorite movie or even work towards that long awaited promotion.
Enough with the chit-chat and the rephrased iconic movie dialogues. Let’s see how we can help you boost your productivity and proficiency at the workplace with the help of advanced Excel skills.
Heading back to basics
The most important trick that worked for me on the Excel journey was working on my basics of functions and other tools. And yes, I learned Excel online.
If you know ten functions by heart, make it a target that you know at least fifteen by the end of the weekend. Make a list of all the available functions in Excel and try to tackle at least 10 each week as a part of rigorous Excel training.
Excel does offer various alternative functions in case you didn’t want to use a certain specific. For example, the TYPE function returns what is the type of the given particular value i.e whether it is a text string, number, error, logical value, etc.
Instead, the ISTEXT, ISNUMBER, ISERROR, ISLOGICAL etc. can be used to determine what is the given value.
What separates the list of functions mentioned above is the natural specificity of the function and the differentiated results that they result.
Whilst the TYPE function returns a numerical value that corresponds to each of the value types, the list of latter functions are all logical in nature and return a boolean value TRUE or FALSE.
You see, each of these results can be further used to build complex formulas that eventually build into an Excel model.
By the way, you can easily find all the functions on the internet with examples on how to use them so learning Excel without guidance is definitely not a constraint.
Practice the learnings
You introduced a few newer functions into the arsenal, now what?
Create a dummy dataset and apply all the functions that you know on the given dataset. That would be step one. Further, try to combine two different functions and see whether they yield any result.
Go on combining different functions to understand how they work together without caring whether they return correct results or not. This fulfills two purpose -
You understand the synergy between two different functions; what would work and what wouldn’t
Help you build an understanding of what to expect when you combine different functions.
You probably must be wondering - “Wait, we already know this! Why are we even here?” To be honest, this is the best piece of advice you would find in this article or even anywhere on the internet, except ChatGPT; that son of a gun is a smart fella.
Array formulas
If you are still looking for a ‘real’ piece of advice, this is where it begins. Generally, a normal formula can perform a single calculation and returns the result in the selected cell.
On other hand, array formulas are a different beast altogether. They have the capability to simultaneously perform multiple calculations on different items of an array.
For example, suppose that you have the data as illustrated below:

The objective is to find the total number of characters in all the text strings which can be fulfilled using the LEN function.
Now, any Excel user in general would individually calculate the length of the text strings in column C and then use the SUM function to find the total length of all five text strings.

With an array formula, you can completely bypass these individual calculations by using the formula =SUM(LEN(B3:B7)) which gives the result as 28.

What happened behind the scene was that the function formed an array of lengths i.e {2, 5, 6, 5, 10} for the given text string upon which finally the SUM function yielded the cumulative value as 28.
An important thing to remember is that since this is an array-formula, you need to press Ctrl + Shift + Enter after you type the formula or else it won’t work.
What this example displays is just the tip of an iceberg, what an array formula can do is far greater than the ocean.
Excel VBA
Once you have understood how the array formulas work, you can then take one step ahead to include them into the VBA code as well.
For now, we will presume that you understand the basics of how to write a dynamic VBA code that can be used to run a simple Excel model.
Not many people can actually include the array formulas in a VBA code, but the way they work; dear god, it's an absolute beauty.
Importantly, your VBA code would run a lot faster than it generally does since multiple calculations are happening all at once.
If you haven’t written VBA codes that include array formulas, ensure that you double check them since there is a high possibility to make errors while using this deadly combination.
There are several Excel tutorials that show how to write an indepth VBA code including the one’s that has array based calculation.
Power Query
The one function that most people are aware about, but just doesn’t use it is the Power Query. Most Excel users often go to lengths of copying the data from the Excel file, deleting the unnecessary columns and rows and then finally pasting it into a completely different file.
Instead what they can just do is import the data using the Power Query, run a couple of queries as to what columns are needed and what isn’t, whether any additional filters need to run such as date and time to finally give the data that you require.
You can add the data from all the different data sources such as Excel files, SQL server database, azure, online services etc and eventually transform the data accordingly.
Data Visualization
If there’s one thing that someone must know by heart to progress as an Excel wizard, then it is the different data visualization techniques, especially the Pivot tables.
Pivots will make your life a lot easier, in case you are working on a lot of data tables. Graphs are okay, they are easier to build. You just need a ready-made dataset that is filled with unique values (used for X-axis) which will eventually return any type of graph.
However, what if you have duplicate values in the dataset? Let’s say the test scores for all the 40 students in six different subjects.
That way, you would find each student six times in the dataset along with the text scores which might make the graph a lot more misleading.
Instead, what you can do is create a pivot table that essentially removes all the duplicates and consolidates the data so that you have the summarized line items for each value.
Suppose that we have the data as illustrated below:
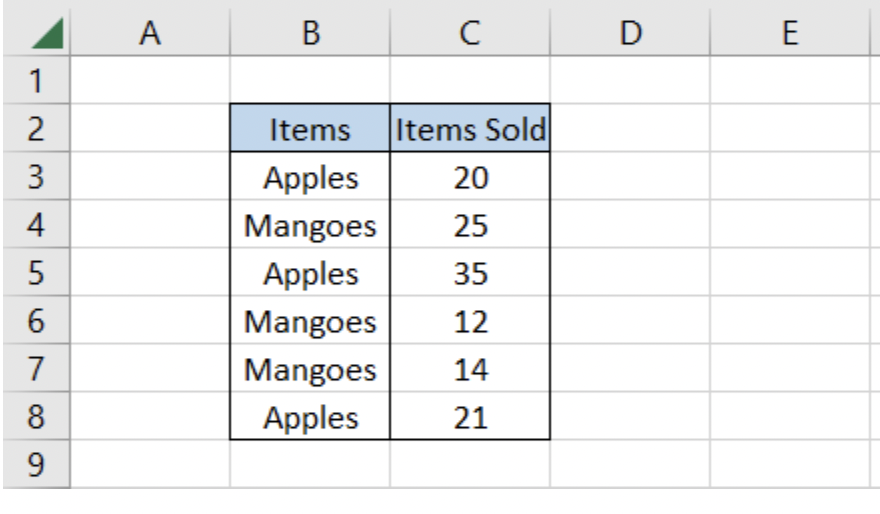
To use the pivot tables, we will first select the entire data and then click on Insert > Pivot Table > Add on New Worksheet and then finally select the relevant headers for the pivot table.
If we wanted to evaluate how many times Apples and Mangoes respectively appear in the dataset, then the ‘Items’ would be assigned to rows and values field as below:

This gives the result:

Similarly, if we wanted to evaluate the total count of Apples and Mangoes in the dataset then the columns assigned to different pivottable fields are:

This time we get an entirely different result as:

We had a limited six rows of data but what pivot tables did was clearly amazing to further consolidate the data and give even further insights.
There are no limits to how you can use the Pivot Tables if you include them in your Excel training plan and later on combining it with graphs or other Excel tools makes it absolutely unstoppable.